Two Charts That Capture Q3 Earnings Season
The Q3 2019 earnings season surprised mildly to the upside.
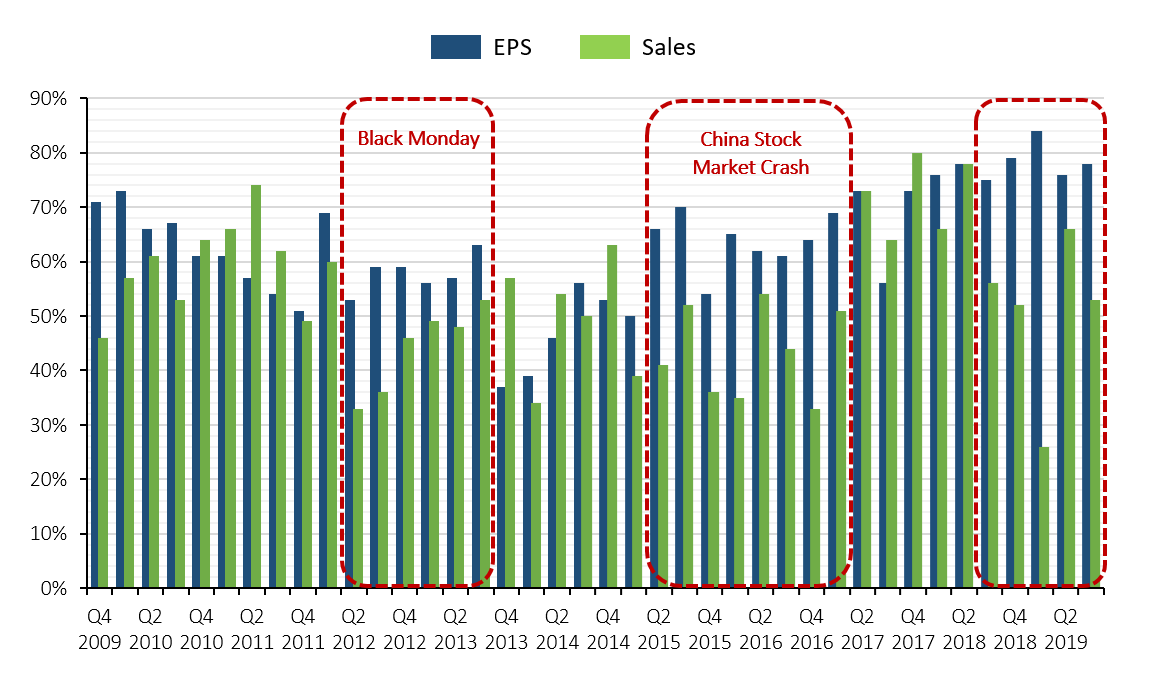
Percentage Of Companies That Beat Analyst Targets
Looking at the chart above, we see that over the past 3 years the number of companies that beat their EPS targets has increased to what seems like a sustainably new level between 70-80%.
This consistent outperformance looks great, unfortunately the sales paint a different picture.
Over the past few quarters, there has been a divergence in EPS vs sales performance. In fact, Q1 2019 saw the largest divergence of the past 20 years when 84% of companies beat on EPS, but only 26% beat on sales (68% missed). Since the 2008 financial crisis there have been only three extended periods of this kind of divergence that coincidentally align with disruptions in the market.
On ‘Black Monday’ in 2011, rating agencies downgraded US sovereign debt from AAA to AA+, crashing the stock market. From peak to trough the S&P 500 dropped roughly 19%.
In 2015 China’s stock market crash sent shockwaves across global markets. From peak to trough the S&P 500 dropped roughly 15% and 19 months passed before it broke through previous highs.
The combination of (previously) rising interest rates and an escalating trade war is causing this third period of market disruption.
This makes sense. During periods of heightened uncertainty, aggregate demand slows. Companies end up selling less product, and sales underperform. Earnings, on the other hand, don’t because they can be manipulated through margin controls and share buybacks. For example, in 2018 over $1 trillion worth of buybacks was announced. Our research shows that had S&P 500 companies not engaged in these buybacks, year-on-year EPS would have actually contracted in every single quarter of 2019 to date.
Unfortunately for stock prices, the buyback frenzy is dying down and we are seeing signs, especially the rise in manufacturing input prices and tight labor market, that margin expansion has probably peaked.
If either demand does not return or forward EPS estimates are not brought down significantly, then 2020 EPS outperformance is at risk. As a result, CEO’s are already pulling back on their guidance numbers.

Percent of Companies That Raised v. Lowered Profit Guidance Q3 2019
43% of companies lowered their FY2019 profit guidance ranges on their recent Q3 earnings calls, and another 27% have either kept them in-line or chosen not to give an update. Only 1/3 of companies have raised their guidance.
The technology sectors tend to be more growth-oriented, and without that culture of tight margin control in place, a pullback in demand hits the bottom line hard. Meanwhile, sectors like Process Industries and Producer Manufacturing, which have been most affected by the ongoing trade war but do have a culture of margin control, seem to be doing better than feared.
I want to receive Mirador’s research and market updates!
Information presented reflects the personal opinions, viewpoints and analyses of the employees of Mirador Capital Partners, LP, an SEC-registered Investment Adviser. The views reflected in the commentary are subject to change at any time without notice. Nothing herein constitutes investment advice, performance data or any recommendation that any particular security, portfolio of securities, transaction or investment strategy is suitable for any specific person. Any mention of a particular security and related performance data is not a recommendation to buy or sell that security. Mirador Capital Partners, LP manages its clients’ accounts using a variety of investment techniques and strategies, which are not necessarily discussed in the commentary. Investments in securities involve the risk of loss. Past performance is no guarantee of future results. Visit us at miradorcp.com for more information.